Geologically minded geophysics
PETROPHYSICS
The natural link between geology and geophysics....
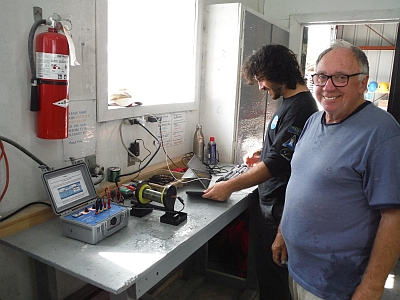
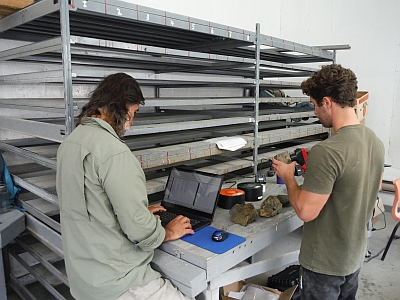
Despite being the only way to know the actual contrast between the geological units being targetted, it is unfortunate how little petrophysical data is collected during exploration programs. Working with Bill, we have established a very efficient system that allows us to rapidly measure magnetic susceptibility, density, DC-resistivity and chargeability of hand and core samples.


We have a GDD SCIP-tester for DC-Res & Chargeability, scale for density measurements, and a Cormageo RT-1 susceptibility meter, as well as a Q-Meter for measuring the intensity of remanent magnetization. Of course, without proper data acquisition and analysis procedures, the data collected could be just numbers disconnected from geology and geophysics. This is where Bill and Hernan's experience shines...

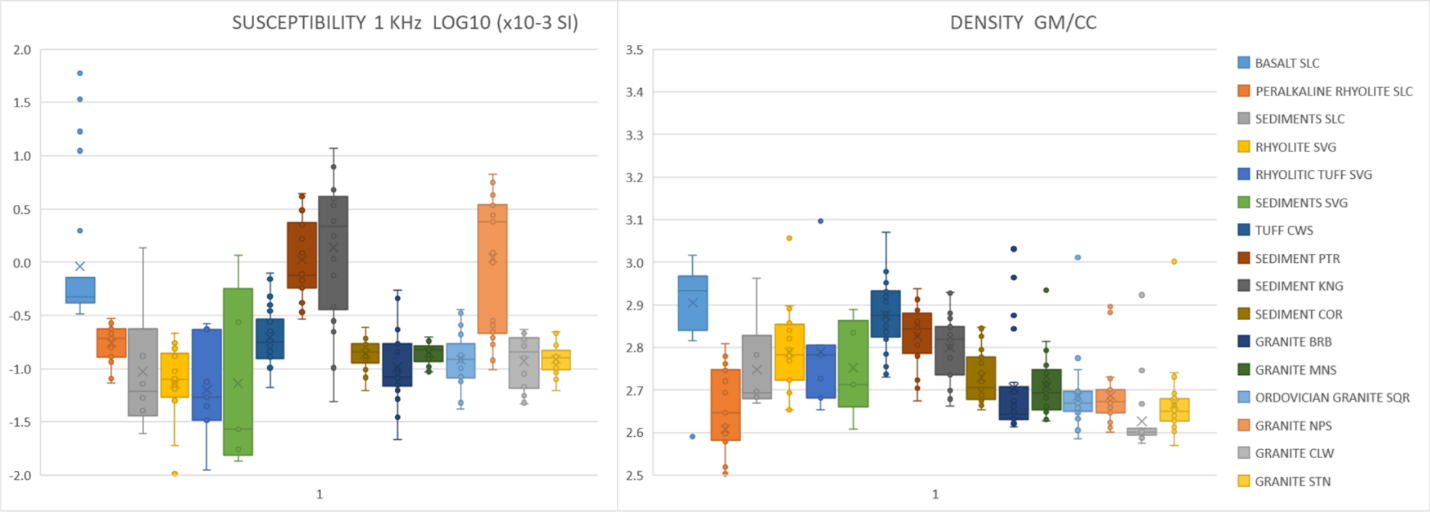
The above image shows box & whisker plots for susceptibility and density for the southern Bathurst area, where Bill and Hernan have been working with GNB. These plots allow for a quick evaluation on the nature of the contrast between lithologies for the understanding of gravity and magnetic data. But that's not all.

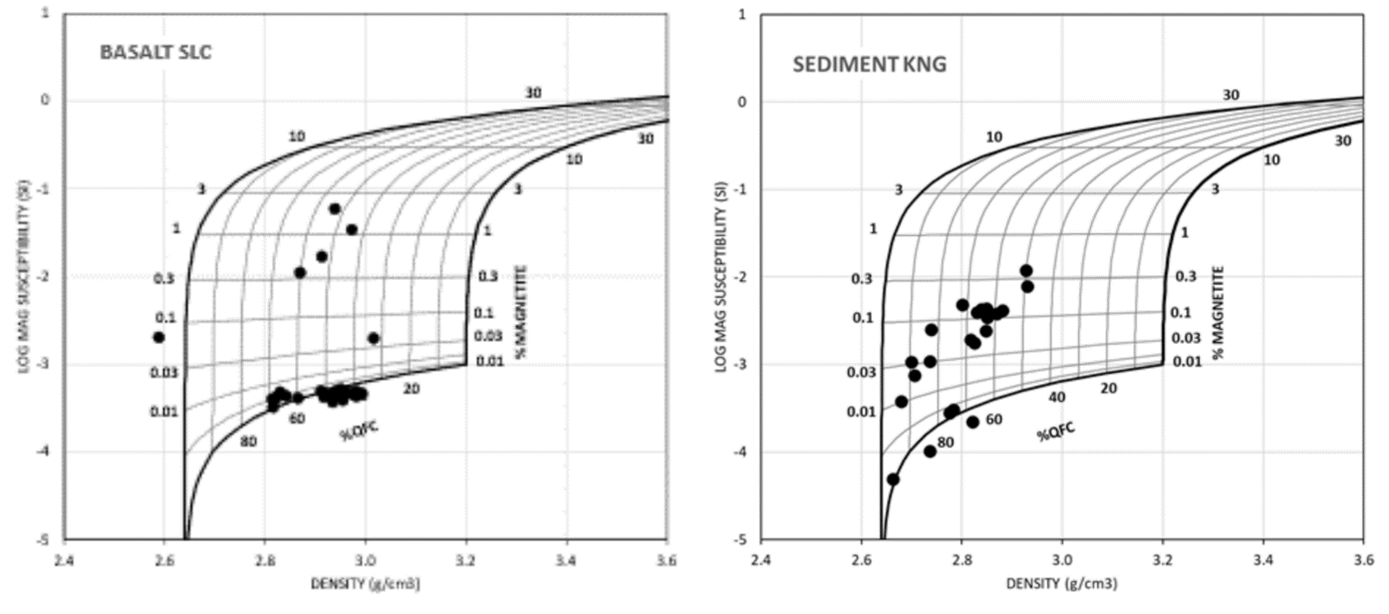
These are Henkel plots for two rock types in Southern Bathurst. Part of the theory behind is published here, but in short, by looking at the distribution of magnetic susceptibility vs density one can do a much finer mineralogical separation: paramagnetics vs ferromagnetics, expected percentage of Quartz, Feldspars and Calcites (QFC) and magnetite. And from here, it is possible to go into rock type separation, possible alteration processes, etc.
